Replacement Alert: This map chart has been replaced by a newer version.
This page describes how to create a colored map using the Charts API.
Table of Contents
Chart-Specific Features |
Standard Features
|
Overview
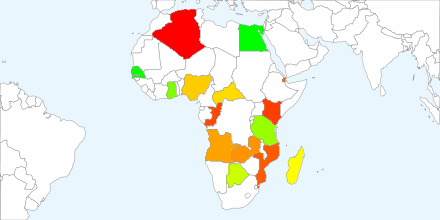
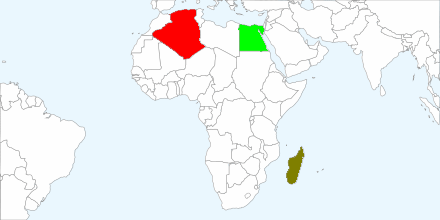
You can create a map with various countries or states highlighted in custom colors. To specify a map, you will specify which region of the world the map should zoom into. You will also specify a list of regions that should be colored in the map, and a parallel data list that assigns a numeric value to each corresponding country. Each country is colored along a gradient, according to the value assigned to it. You can optionally specify a custom color gradient for data values.
Map charts support the following parameters:
| Parameter | Required or Optional | Description |
|---|---|---|
cht=t |
Required | Specifies a map chart. |
chs |
Required | Map size. Maximum size for a map is 440x220. |
chtm=<zoom_area> |
Required | Geographical area shown in the chart.
|
chld=<country_or_state_codes> |
Required | A list of countries or states to which you are applying values.
Example: |
chd=<country_values> |
Required | A list of values parallel to the list of regions, where the value applies to the corresponding region. Values are standard formatted data values. Each region will be assigned a color along the scale specified in chco, where the lowest value in the range applies to the lowest color, and the highest value in that range applies to the last color.
|
chco=<default_color>,<start_of_gradient>,...,<end_of_gradient> |
Optional | A range of colors corresponding to the low and high data values for the data format range. Data values are converted to color values along this gradient, and applied to the corresponding countries.
|
chtt, chts |
Optional | Chart title and style |
chma |
Optional | Chart margins |
chf=bg |
Optional | Solid fills (background only) |
Examples
| Description | Example |
|---|---|
In this example:
|
|
This chart is similar to the previous one, but with more detail. |
 chtm=africa |
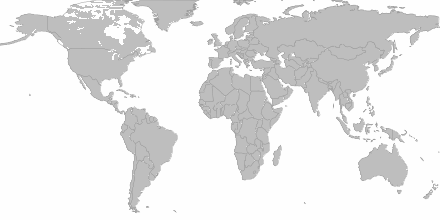
This chart specifies that no countries
are highlighted by specifying a single, undefined value ( |
 chs=440x220 |
United States State Codes
Here are the supported state codes when the map is zoomed into the United States
(chld=usa).
| AL | Alabama | LA | Louisiana | OH | Ohio |
| AK | Alaska | ME | Maine | OK | Oklahoma |
| AZ | Arizona | MD | Maryland | OR | Oregon |
| AR | Arkansas | MA | Massachusetts | PA | Pennsylvania |
| CA | California | MI | Michigan | RI | Rhode Island |
| CO | Colorado | MN | Minnesota | SC | South Carolina |
| CT | Connecticut | MS | Mississippi | SD | South Dakota |
| DE | Delaware | MO | Missouri | TN | Tennessee |
| FL | Florida | MT | Montana | TX | Texas |
| GA | Georgia | NE | Nebraska | UT | Utah |
| HI | Hawaii | NV | Nevada | VT | Vermont |
| ID | Idaho | NH | New Hampshire | VA | Virginia |
| IL | Illinois | NJ | New Jersey | WA | Washington |
| IN | Indiana | NM | New Mexico | WV | West Virginia |
| IA | Iowa | NY | New York | WI | Wisconsin |
| KS | Kansas | NC | North Carolina | WY | Wyoming |
| KY | Kentucky | ND | North Dakota |
Standard Features
The rest of the features on this page are standard chart features.

